Data Visualisation
Visual Analytics Excellence
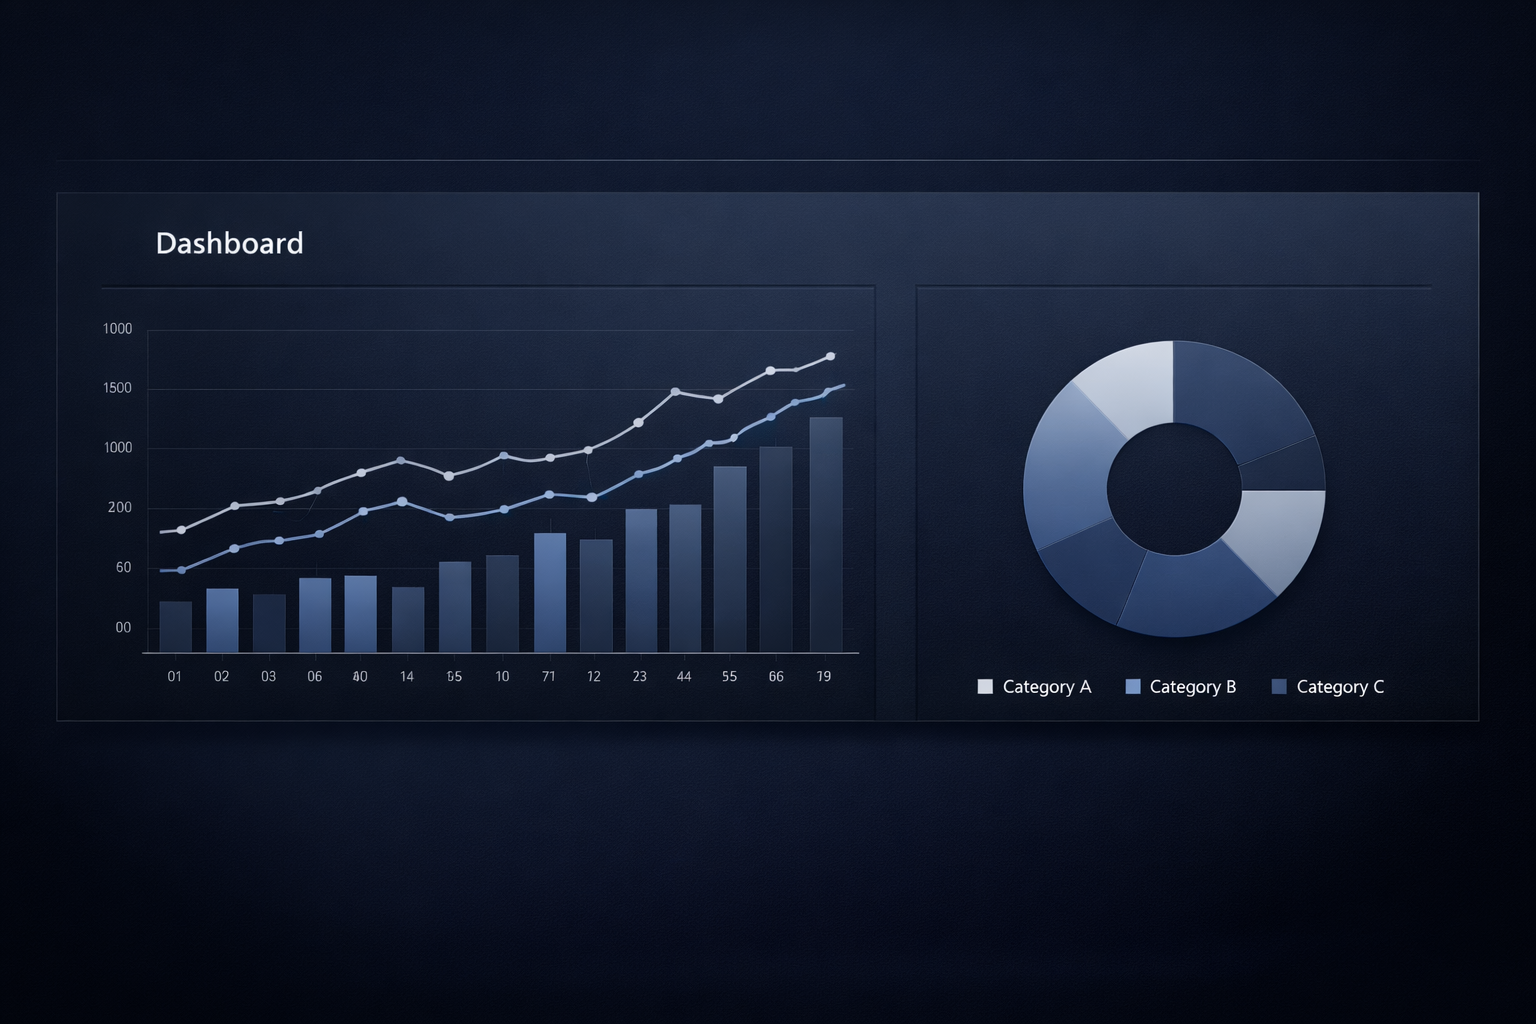
Turn simple quantitative figures into insightful, practical, and engaging pieces of information that empower you to steer your business with complete assurance.
Custom Chart Design
Tailored charts to the specific metrics that are most relevant to your business's unique goals.
Real-Time Data Sync
Your visuals reflect the changes in your business, providing the most up-to-date information.
Simplified Complex Patterns
We transform complex information into simple, clean, and easy-to-read content.
Exportable Graphic Reports
Effortlessly convert your digital dashboards into professional presentations or PDFs for your meetings.

Making Countable Data Interesting
Interesting and complex data are the two opposing forces in the world of numbers. Data becomes narratives when colourful analytics and data visualization are used. We create data charts and maps that pinpoint a business's strengths and weaknesses. We make data accessible to the public.

Increasing Efficiency in Decision Making
When data are available, decisions can be made more quickly. Rather than analyzing lengthy reports, data dashboards can answer the central questions. In the rapidly changing North American landscape, the ability to make quick decisions is an advantage.

Anticipating Trends
First, visual analytics enables the user to gain a holistic view. Visual aids can be used to spot growth in demand or a decline in sales. Instead of being reactive, the business can be seen as proactive. Positioning the company as a leader in anticipation of change.
Leaving a Good Impression on Stakeholders
Visual data, whether for investors, partners, or employees, helps the business to appear more sophisticated. Visual aids enable the professional to demonstrate a thorough understanding of the business model. Your high-quality visuals demonstrate that you work with almost divine accuracy, making it easier for you to garner support for your visions and goals.

“The visual dashboards transformed our messy spreadsheets into clear, actionable insights. Decision-making has never been faster.”
Rachel Thompson
Data Analyst

“Our investors are impressed with the professional reports. The visualizations make complex data easy for anyone to understand.”
Andrew Martinez
Startup Founder

“We can now spot trends before they become obvious. This proactive approach has given us a real competitive advantage.”
Tom Lee
Strategy Director
Where brand meets creativity
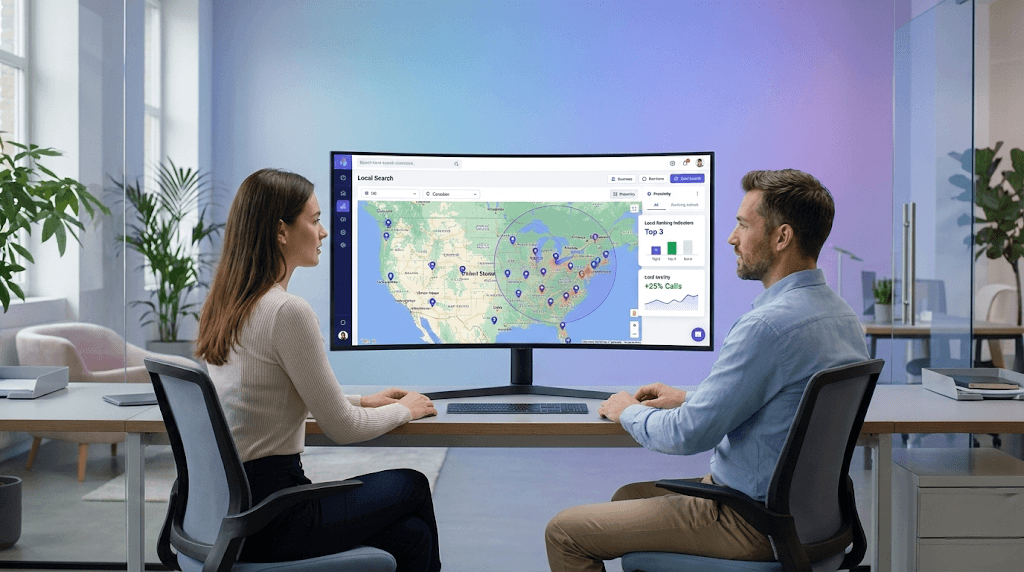
Local SEO Services
We assist businesses in gaining customers through enhancing visibility in local searches, improving visibility in maps, and increasing driving calls, visits, and leads in the North American market.